Either way, withdraw effects on the market, keeping prices down, will stop, meaning a significant price increase would be expected. But not till sometime next year.
I’m most worried about getting to a level where we can’t use it as leverage and/or the other side can use it against us.
Some of its value is that we have it if that makes sense.
2 Likes
This is the key. Every barrel that goes out diminishes our ability to absorb significant market shocks.
Once traders lose confidence that supply levels are safe, every little disruption becomes a big deal.
SPR supplies won’t stop - they’ll dwindle like an oil well that starts watering out.
1 Like
4 straight months of manufacturing expansion
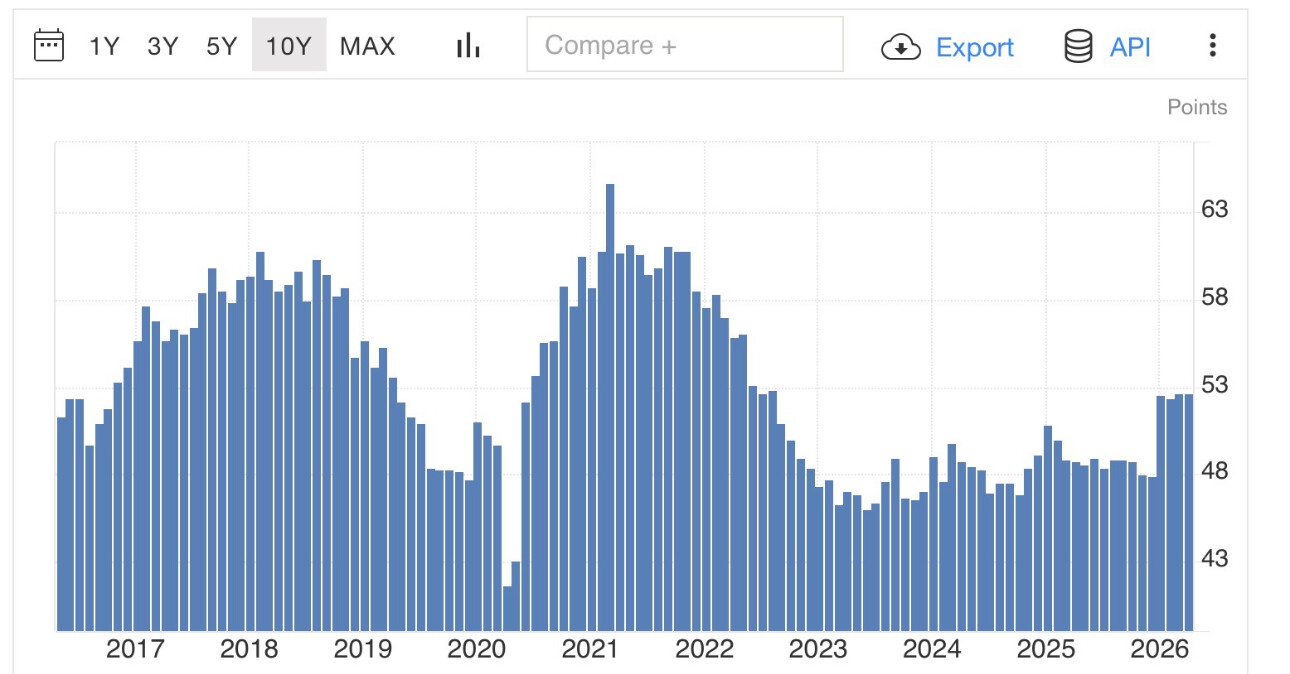
Figures don’t like but liars figure example 40 trillion and three.
So manufacturing expansion, but manufacturing employment flat thru
June 2026. Can it be explained by a spike in productivity among existing
workforce or greater factory utilization rates ? Discuss. What am I missing
here between these 2 graphs.
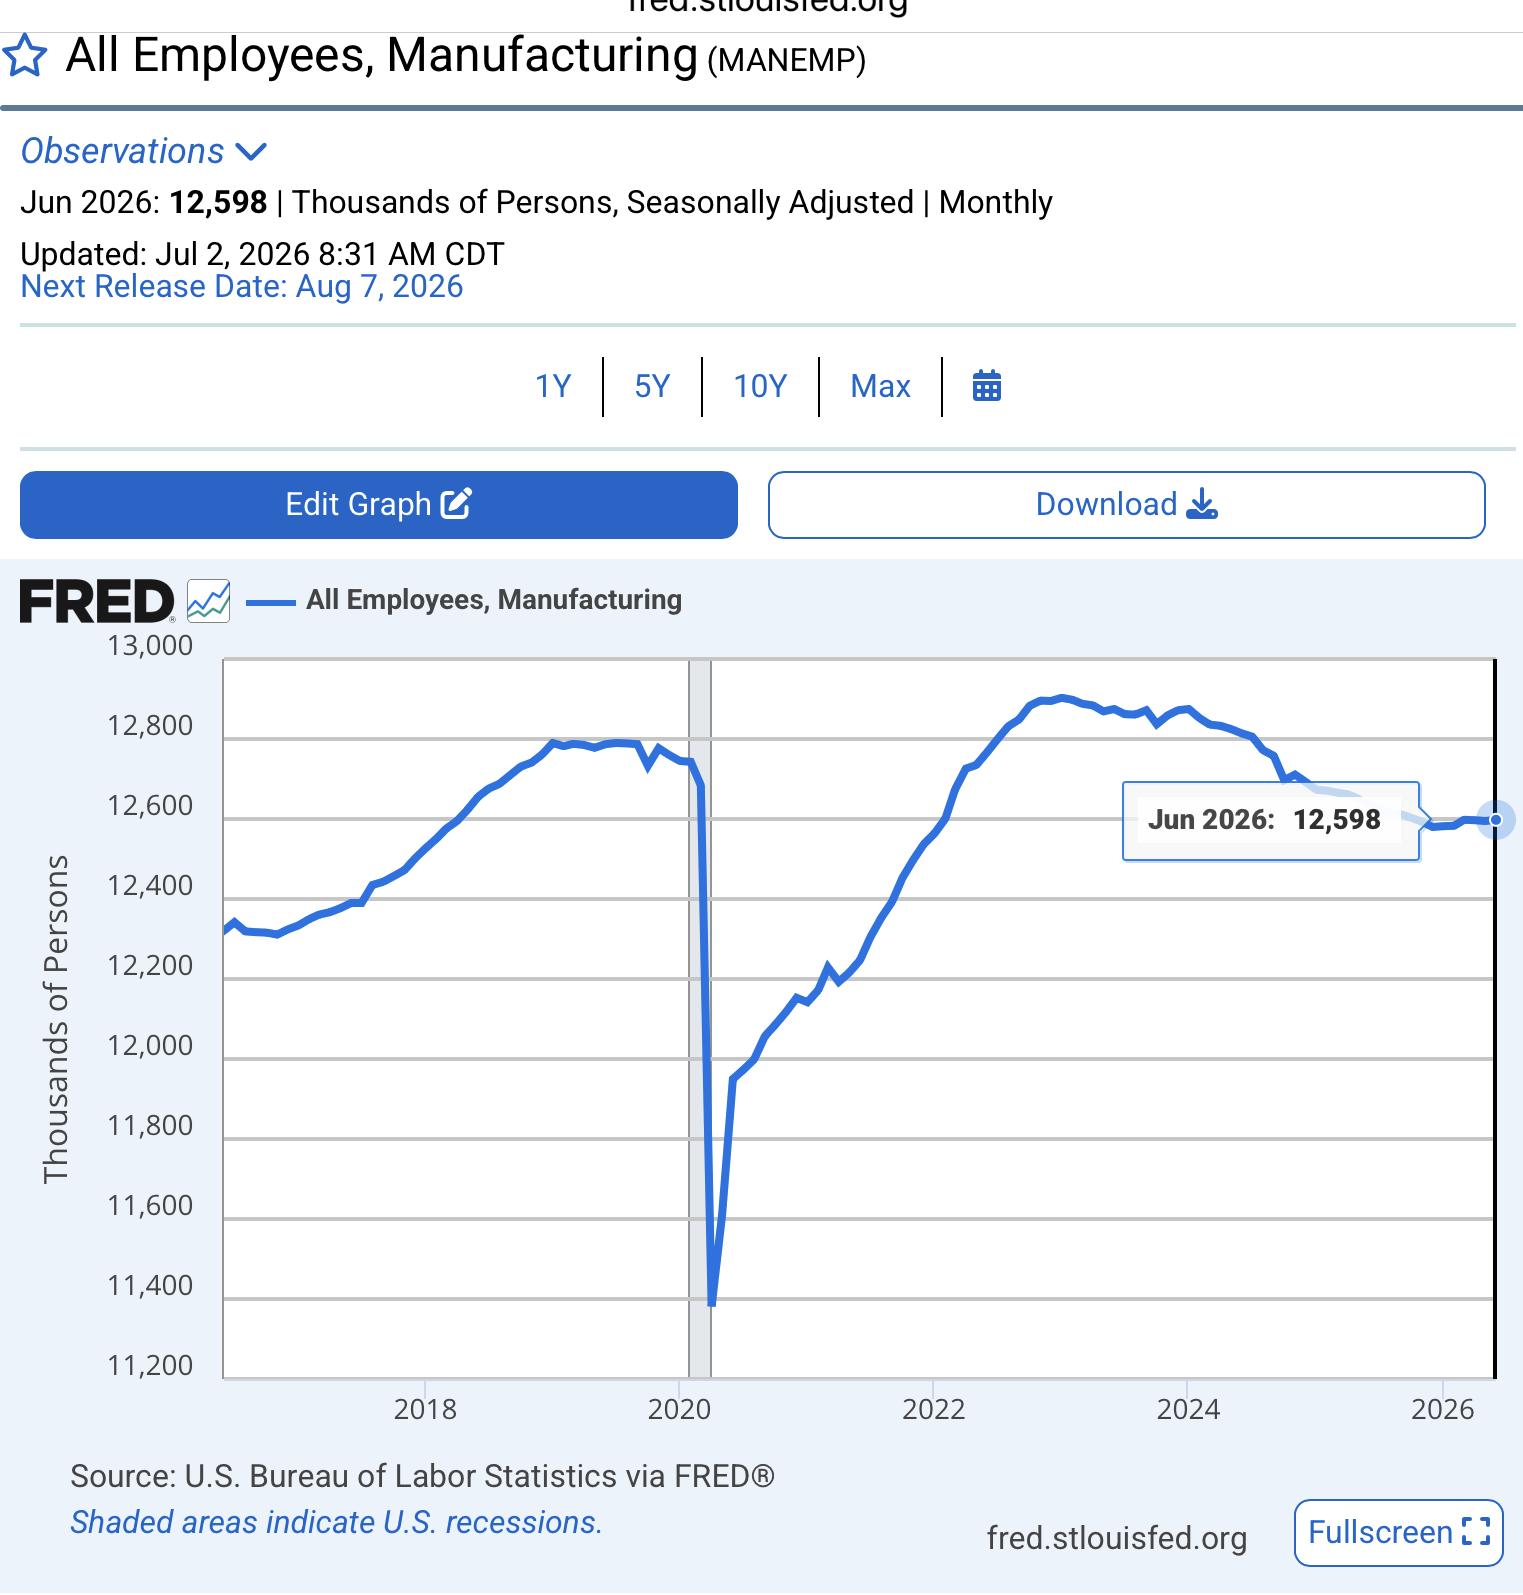
Edit- I’ll add in what ISM is and weaknesses in the data for clarification.
The primary flaw of Institute for Supply Management (ISM) data is that it is “soft” qualitative data based on subjective sentiment, rather than “hard” quantitative data that measures actual production volume, dollar amounts, or employment numbers. [1, 2, 3, 4, 5]
While the ISM PMI Reports are highly regarded leading indicators due to their early monthly release, financial analysts must account for several structural weaknesses. [1, 2, 3]
- Account for Qualitative and Structural Weaknesses
-
Binary Diffusion Metric: The survey only tracks the direction of change (Better, Worse, or Same), not the magnitude. A firm increasing production by 1% and a firm increasing production by 50% both register an identical positive response. [1]
-
Sample Bias: The survey pool is restricted specifically to ISM members, which introduces corporate and selection biases compared to scientifically randomized government census samples. [1, 2]
-
Sentiment Distortion: Purchasing managers are vulnerable to psychological bias. General macroeconomic anxieties, geopolitical headlines, or tariff uncertainties can cause negative survey responses even if actual factory output remains flat. [1, 2, 3, 4]
-
Equal Weighting Issues: The composite ISM Manufacturing Index weights its five subcomponents equally (20% each), regardless of whether one component is driving a disproportionate share of economic reality. [1, 2]
Bad news on jobs; but unemployment remains low, for probably bad reasons.
A summer hiring slump dogged the US labor market in July as the economy unexpectedly lost 23,000 jobs, according to new data released Friday by the Bureau of Labor Statistics.
The unemployment rate dropped to 4.1% from 4.2% as more people left the labor force.
July’s job gains marked a sharp slowdown from June’s total, which was downwardly revised to 20,000 from 57,000. Following revisions, May’s employment gains were essentially halved, dropping to 66,000 from 129,000.
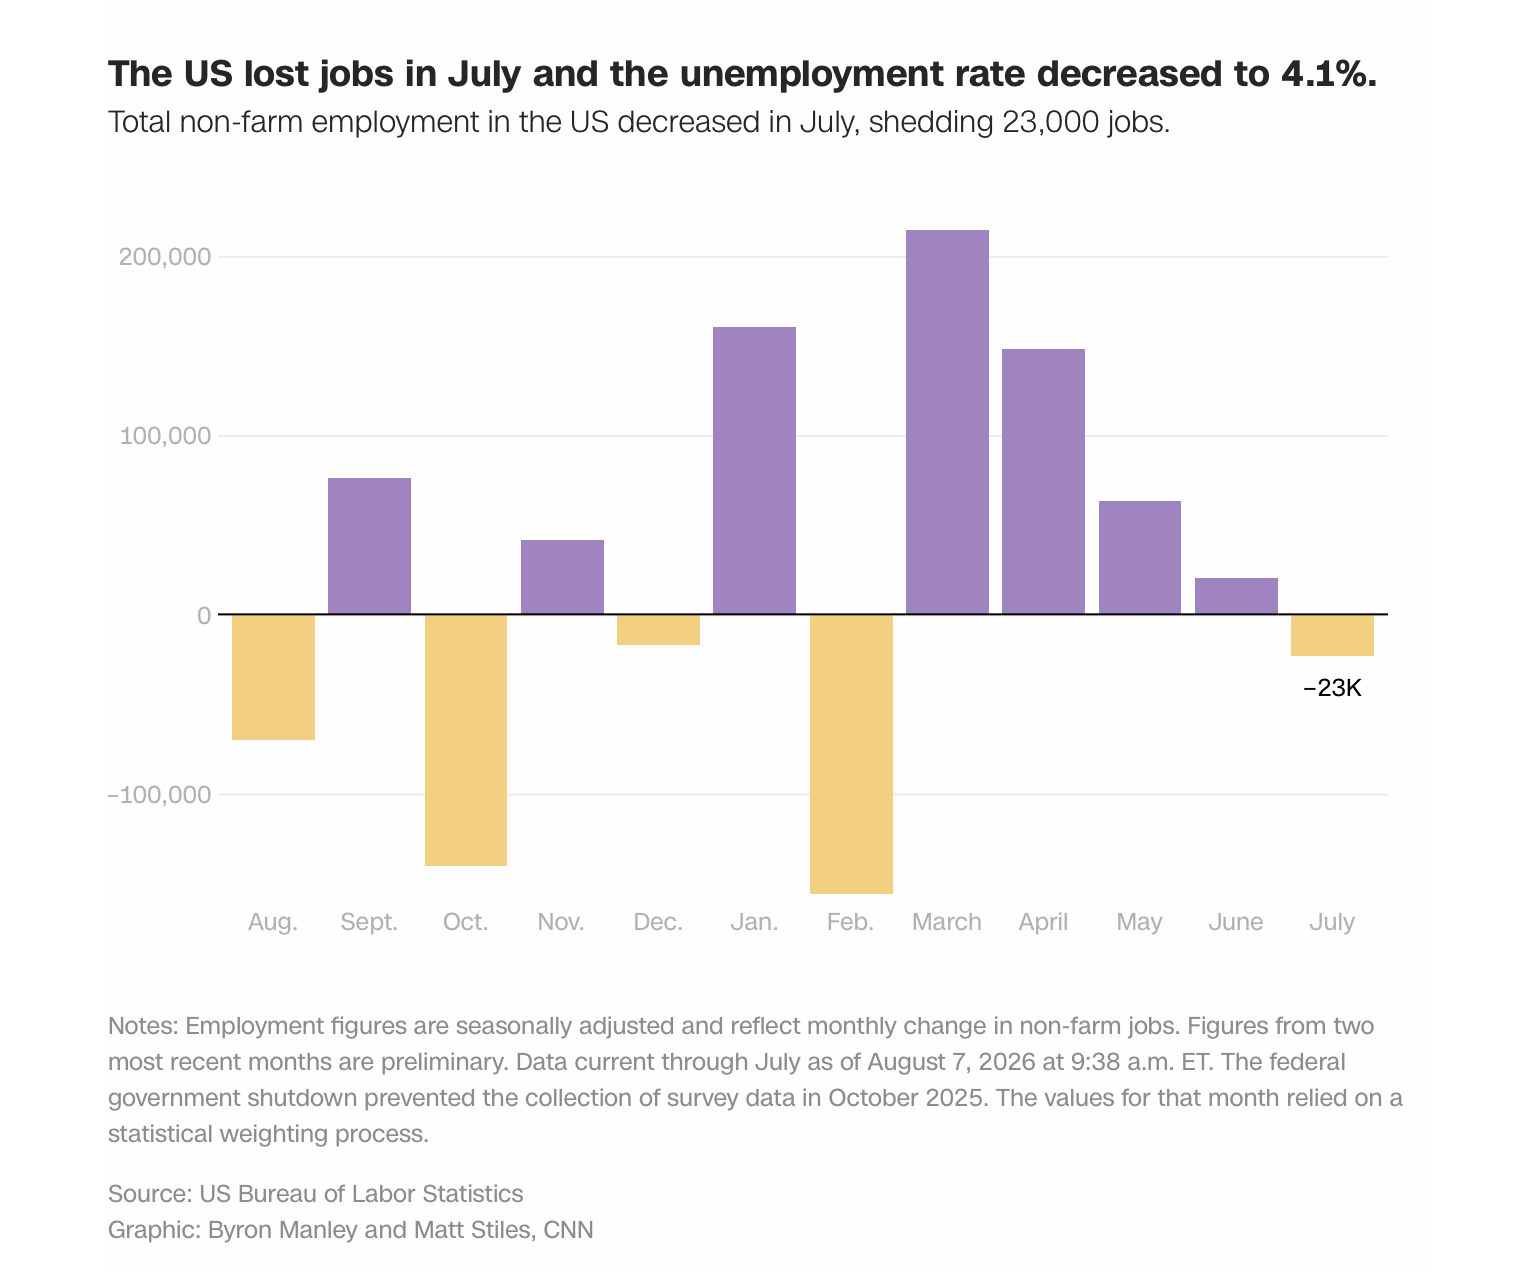
Weird report. Manufacturing up but leisure/hospitality down a lot. Everyone thought the World Cup would give it a bump. I think the number of restaurants cutting back or closing outright is a big factor.
2 Likes
Think that’s a solid observation on the World Cup effect and related hospitality jobs.
But manufacturing is still mostly flat.
U.S. manufacturing employment hovered around 12.61 million jobs in July 2026, reflecting a minor increase of about 5,000 payroll jobs for the month. Monthly job gains and losses in the sector have remained tight and range-bound, tracking closely with ongoing shifts in durable and non-durable goods production
Yes, 5,000 isn’t huge but it keeps the momentum forward. I thought 8,000 government jobs was surprising but not sure where and what type they were. Could be military, no idea
Yeah, not great.
AI summary, but Business Insider has more details.
Sector Breakdown Highlights
-
Government: Lost 53,000 jobs overall, heavily driven by a drop of 50,000 in local government education due to seasonal school-year endings. [1, 2]
-
Leisure and Hospitality: Decreased by 40,000 jobs over the month. [1]
-
Retail Trade: Dropped 19,400 jobs, led by losses in warehouse clubs, supercenters (-21,000), and gasoline stations (-5,000). [1, 2]
-
Financial Activities: Continued a downward trend with a loss of 14,000 jobs, reflecting cutbacks in credit intermediation and insurance. [1]
-
Health Care: Continued its upward trend by adding 22,000 jobs, though at a slower pace than its prior 12-month average. [1]
-
Construction: Added 22,000 jobs in July. [1]
-
Professional and Business Services: Gained 18,000 jobs. [1]
-
Information: Increased by 11,000 jobs. [1]
-
Other Major Industries: Showed little overall change over the month, including manufacturing, wholesale trade, mining, and transportation. [1]
The other part of the story is that there were significant downward revisions in the May and June job numbers (almost 55% lower), too.
Some used to say that was done for political reasons.
1 Like
This quote is quite inciteful…nice job moderator
Both sides do it. Whoever is in office says this stuff happens for political reasons and then are quiet when it happens the other way.
It’s in this very thread. Truth is, it’s not at all political.

1 Like
I saw that Kevin Hassett (director of the National Economic Council) said that about the school year endings… but my understanding is teachers on summer break are still considered employed when it comes to the jobs report so I’m not sure if that excuse or reason holds water.
No Educators lose their jobs in The Summer. Zero. They simply do not have to come to work for a while. Their Annual Contracts are usually paid over 12 months, not 9 months.
Our Economy is losing jobs. Period.
2 Likes