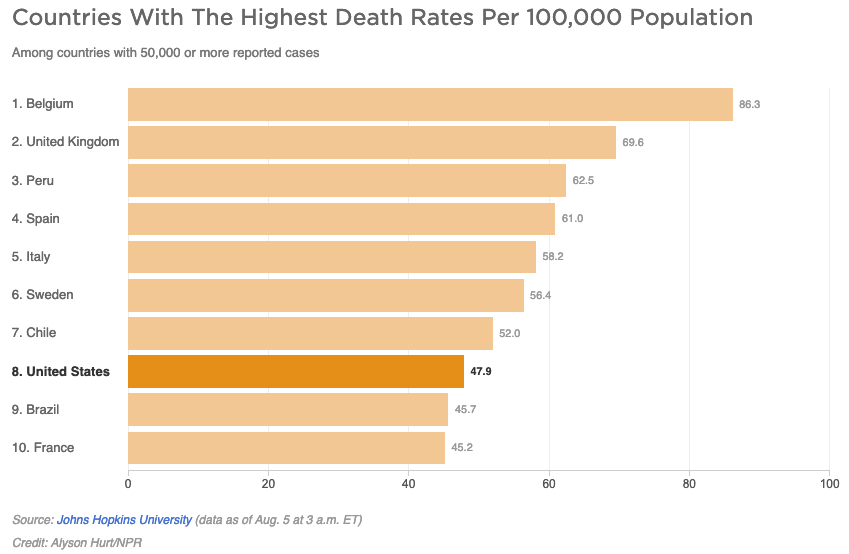
Well our national media has a lot of information flying around most of which shows the USA in a bad light. So here the Covid-19 deaths calculated as a percentage of the population. So you be the judge how the USA is doing. I tried to pick countries like us.
United States – 0.052%
Canada – 0.024%
France – 0.047%
UK – 0.061%
Italy – 0.059%
In the four other countries the percentage of death rate upon catching the virus is more than double the USA.
California – 0.028%
Florida – 0.042%
Texas – 0.033%
New York – 0.169%
New Jersey – 0.179%
Except for a couple of states, the good old USA is doing ok. We still have a long ways to go. One of the projections I looked up had Texas at over 27,000 death by December 1st. If that is true we are in for a heck of a 4 months because almost twice as many people will die as did in the last in the last five or six months depending on your starting point.
Just a reminder almost 3 million people in the USA died in 2019. That is around 1person every 11 seconds.
Drive safe for most Cougars chances of dying in an accident are greater than dying by the virus.
How about this comparison. US has over 170,000 deaths with population of 330 Million. South Korea, a neighbor to China, with a population of 52 Million had a total of 305 deaths. Let’s divide 330,000,000 by 52,000,000. The US has 6.35 times the population of South Korea. So 6.35 times 305 equals just under 1,936. Yes, US has done one helluva job
Pretty sure we’ve all been exposed a few times to coronaviruses. They cause 15% of all cases of the common cold. Rhinoviruses cause about 40-50% of common colds.
I think there’s a different reason that South Korea faired better than us.
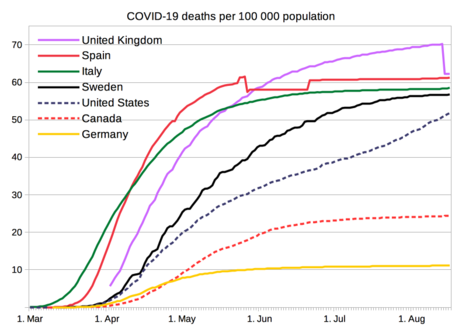
Quantitatively the reason the US is doing poorly is not the death rate. Even if the death rate is comparatively low, if the infection rate is extremely high, then the raw number of deaths will be high. You need to look at deaths per capital, and this is where the US fares much worse than everyone else. This is because we’ve done a poor job controlling spread and our infections are much higher than other counties.
There is another reason that is mostly never brought up.
Our geography and our world leading economy exposed us coast to coast. The chinese virus made its way through the West much earlier than anyone had previously reported. The Stanford study confirmed it. It made its way from china to Europe and develop into multiple strains. Then it made its way from Europe to the East Coast.
If a country had planned this on purpose it could not have been done better. None of the areas or countries previously mentioned had to deal and continue to deal with multiple strains like we did/have hence the difficulty to control these strains in the first place.
NYC received 13.5 million tourists in 2019
Tokyo in 2019 15.2 million in 2019
Just for perspective…but continue…I want to see where you take us.
It was such a clever plan, infect the world…knowing the US would bungle the initial response, pit state versus state, knew we could not handle a lockdown, refused to wear masks, were too selfish in a need to get our drink on and have super spreaders at bars, and the insight to know college kids well, will be college kids and not care…but yes, let’s blame someone else instead of looking in the mirror and accepting…that we put ourselves in the state we are in…but wait I need to know someone else is to blame. Are there clandestine infected international travelers who are arriving daily to skew our numbers to 50k new cases daily?
No but they get a lot of travel from China and Korea. Japan’s first case came from straight from Wuhan itself. The diamond princess cruise line was docked in Japan and patients were being treated in their hospitals. But Japan took it very seriously even though no one really understood what COVID was in Jan/Feb. Tested, traced, and hammered down infections before they became uncontrollable community spread.
You are right about the risk to the US because of the travel through coastal cites, and leadership should have understood that threat much sooner and reacted accordingly. What happened in Japan, Korea, and Italy should have been enough of an early warning for us to react…but we did not.
What’s this multiple strains garbage? That’s a new one.
To be clear, I mean making the different strains out like they are different culprits “to deal with”
I would like to see a chart that adds in racial and cultural diversity to compare how homogenous the countries are with the lower curves compared to the US.
A chart to compare government oversight and regulation of the population base with the curves.
Then a chart to see who would permanently give up what is in the US to achieve the same level of curve should there be another similar outbreak within the next 50 years…