I finally got around to updating it.
Happy New Year, everyone!
Thanks! I can remember some times in the Rob when we had less than 10k in attendance. I am so thankful for where the program is today in regard to attendance and facilities. It can always be much worse. Looking for a great 2018!
Thanks for the update. Just curious, wonder how season tickets and student participation track?
Great to see the increase in student participation.
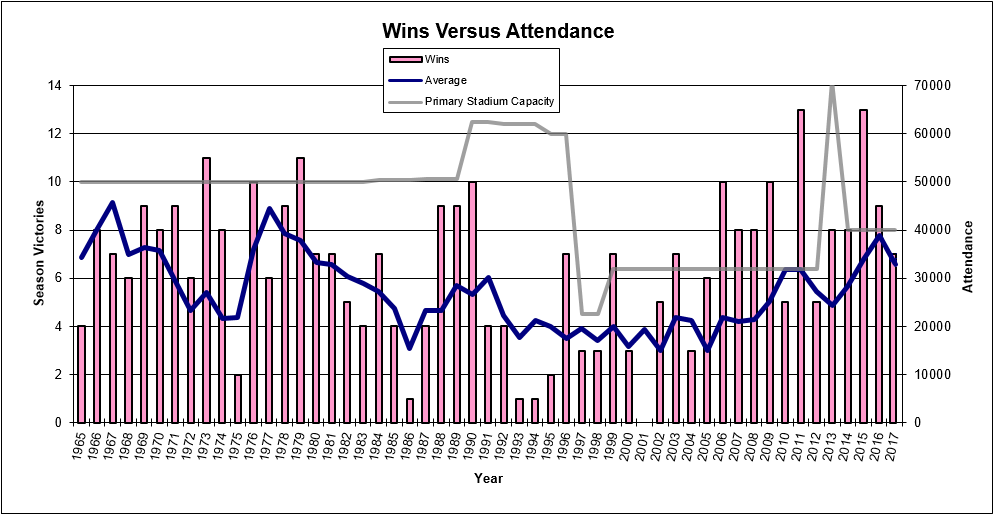
1977 was the peak. We hosted Texas (72k) and came off the #4 ranking. 1976 was our first year in the SWC and had only 18,263 at home for TCU. Coogs add support after winning. Long decline after 1977 despite more success.
Thanks. Obvious that Houston fans stop coming when you don’t win. BTW, did you include or exclude OU at NRG?
Here’s the 2018 edition. That drop over the last two years represents a loss of over 9,000 fans per game, and there’s little doubt that trend would have continued downward in 2019 had Applewhite remained.
This is why letting him go is the right decision.
Thanks, Thomas. Always look forward to this every year.
©Copyright 2017 Coogfans.com
