Duce630
(DustinK - Still 50 hostages held by Hamas for over 630 days)
1058
My problem with that, is it really doesn’t seem like there is any clear strategy at play. Tarriffs on, tariffs off, tariffs at x, now tarriffs at y, and all that time there have been no new trade deals finalized. It is all bluster, all bluff, and no payoff. In the meantime, businesses can’t adjust, budget or plan for what comes off as a “seat of the pants” negotiation.
Personally, I think incentives rather than penalties (tarriffs) is the better way to go. Though we absolutely need to have more production in the US for things that are important to our national security like microchips (fortunately, the CHIPS act seems to be working), medcine, etc.
We had trade agreements in place on January 20, 2025. Those deemed unfair could’ve been negotiated one at a time, but the deciders decided to blow up international trade.
Duce630
(DustinK - Still 50 hostages held by Hamas for over 630 days)
1064
As I’ve said, it seems like no clear or coherent strategy.
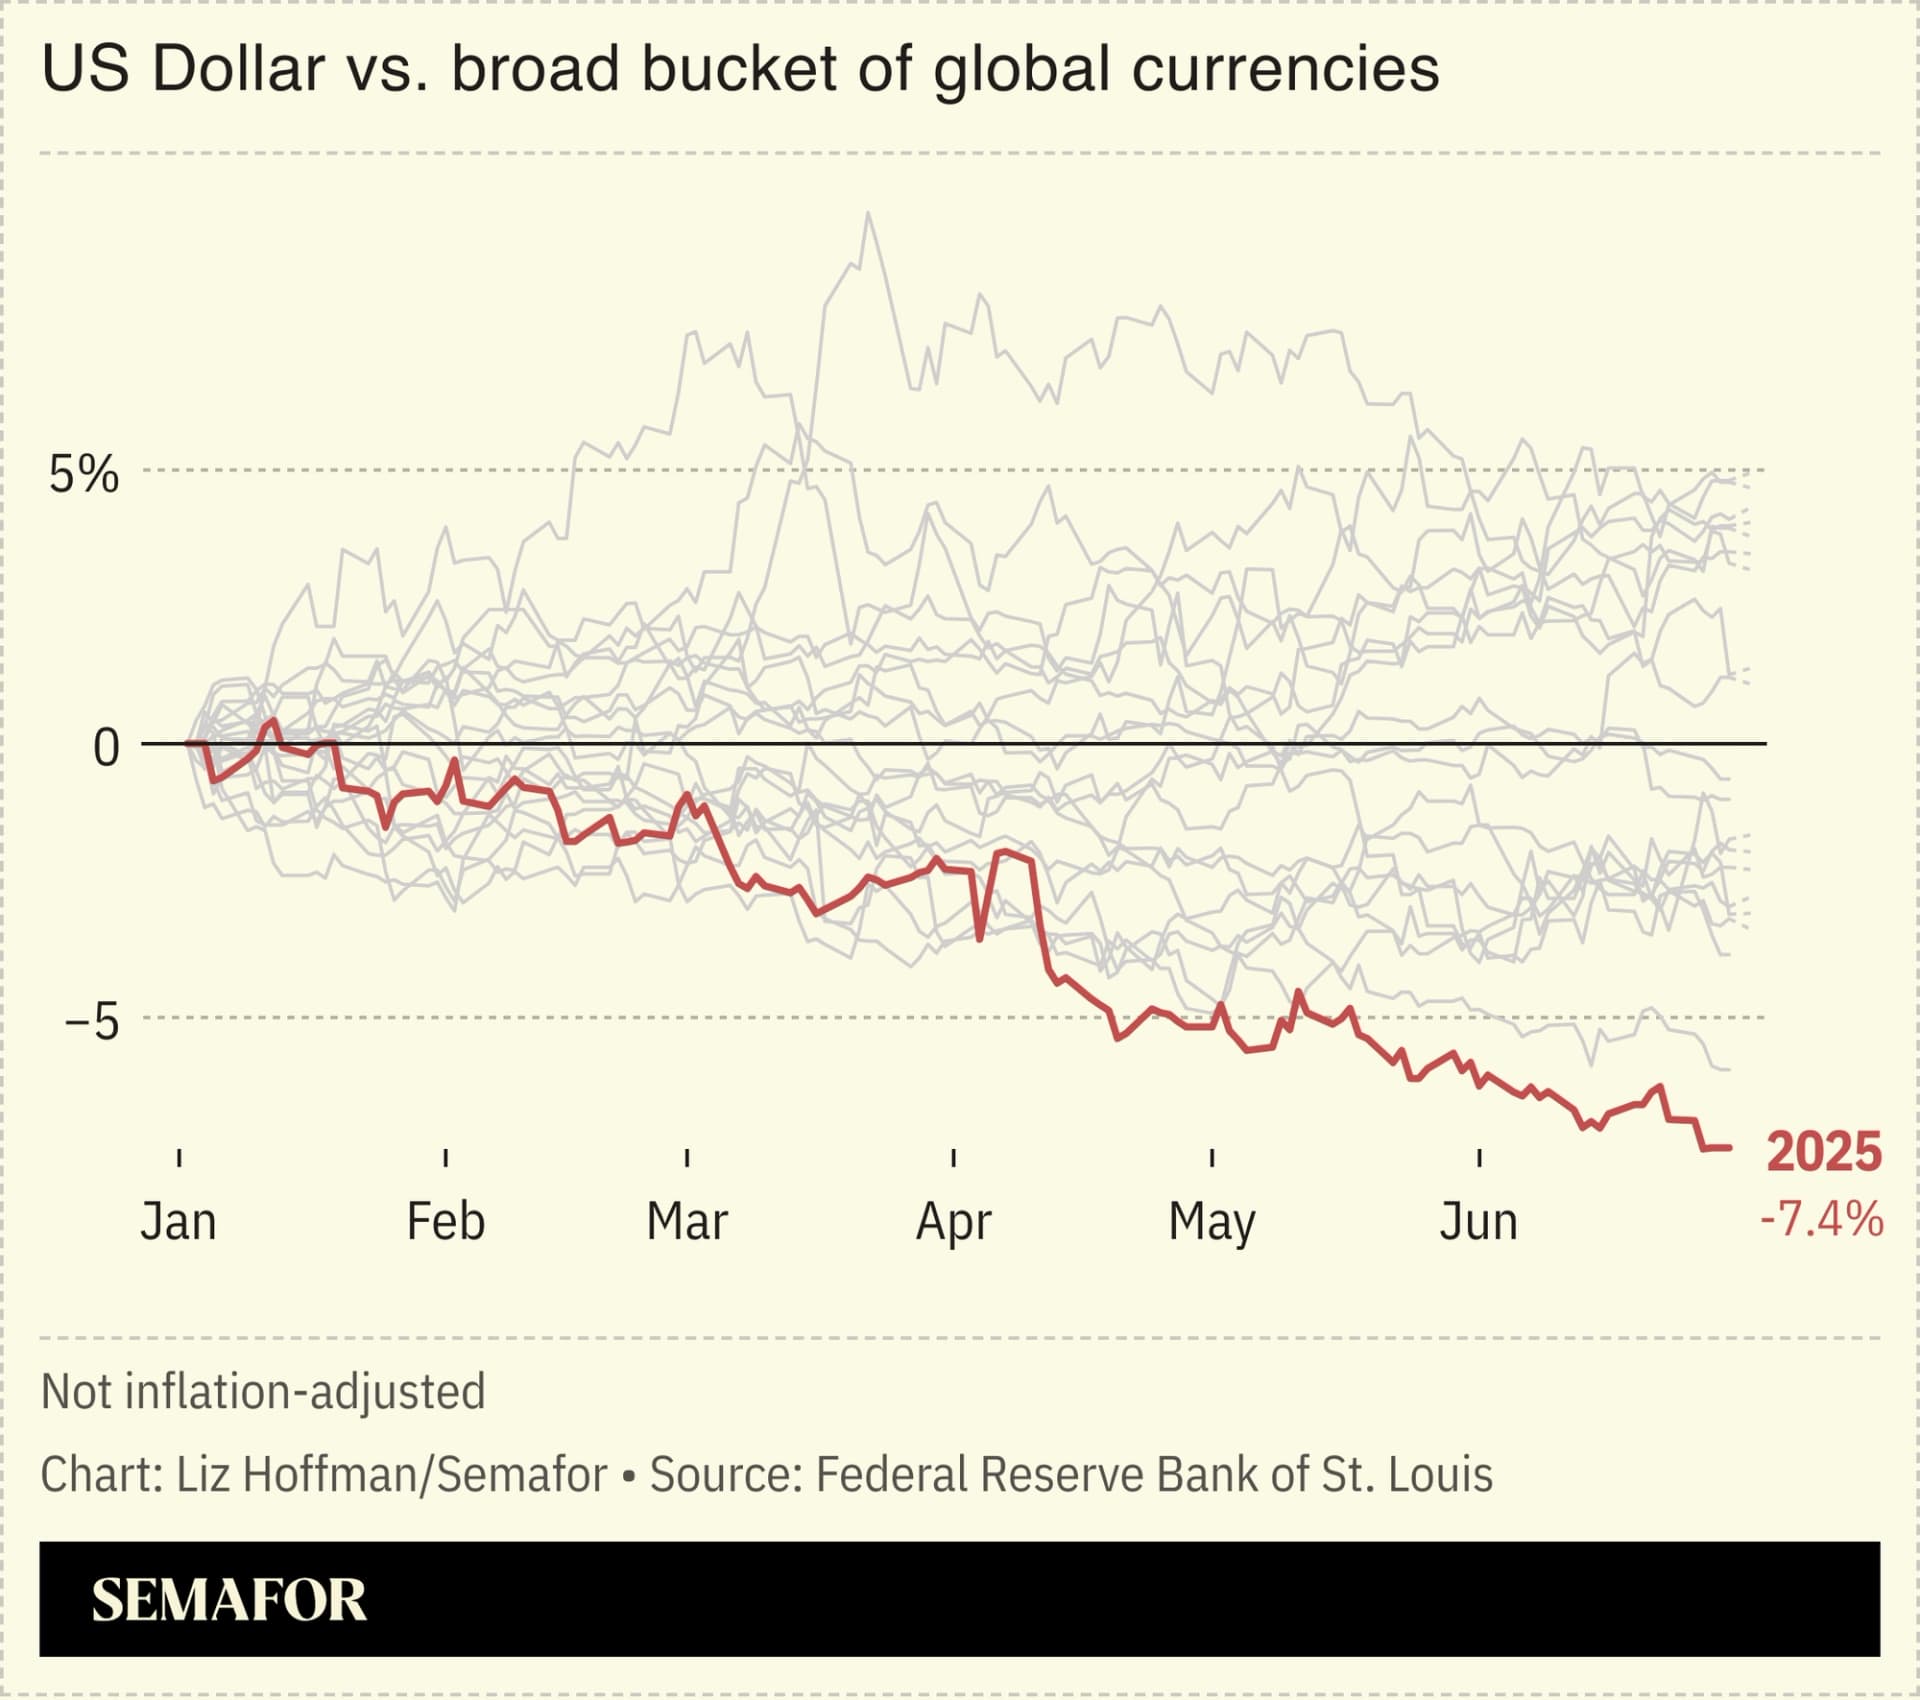
Graphs are useful to see trends. Just looking at a graph is not much,
This is taught in High School and at UH. Many graphs do not show a trend. There are merely endless data points.
The graph posted hereon has a trend. The trend is straight down. That is, a decline in our Exports/Imports ratio. Imports increasing faster than our Exports.
Thus the GDP gets hit with a decline due to that number being part of its calculation. Imports exceeding Exports by ever increasing amounts is a negative hit. Ever increasing.
See how easy it is to “connect the dots” and actually know something?
There is more than one trend in that chart. That doesn’t mean you’re wrong to focus on the larger, longer term trend but others aren’t for saying there is more to it either.
If you look at that graph and interpret it as “straight down”, you need to go back to school and study harder this time.
Sadly, here you’re just defending yourself, your initial false statement, and not learning anything. Maybe you’ll learn better in a classroom setting.
It literally goes down, then up and then down.
What happened in that time that might have caused this? Were the same economic factors at play or were different things happening during that timeline?
I’m saying that our net imports/exports is not a net negative on GDP as Tuscon’s narrative claims. To simplify things, if I spend $1 on an widget that’s an import it gets captured in “C” but then gets subtracted out by “M”. $1(C) - $1(M) = 0. That’s zero impact to GDP.
The latest workforce data suggests that American workers have been the main beneficiaries in the labor market amid the administration’s crackdown on illegal immigration.
The Labor Department’s jobs report for the month of June showed that the number of foreign-born workers declined by 348,000 from May — while the number of foreign-born workers has declined by more than 543,000 jobs since January.
By contrast, the number of U.S.-born workers increased by 830,000 from May to June, and is also over 2 million higher than when the administration began in January.
That comes as a more significant shift in the composition of the workforce when compared with last year during the previous administration, when foreign-born workers gained 1.025 million jobs and native-born workers picked up 1.099 million jobs over the same time period.